
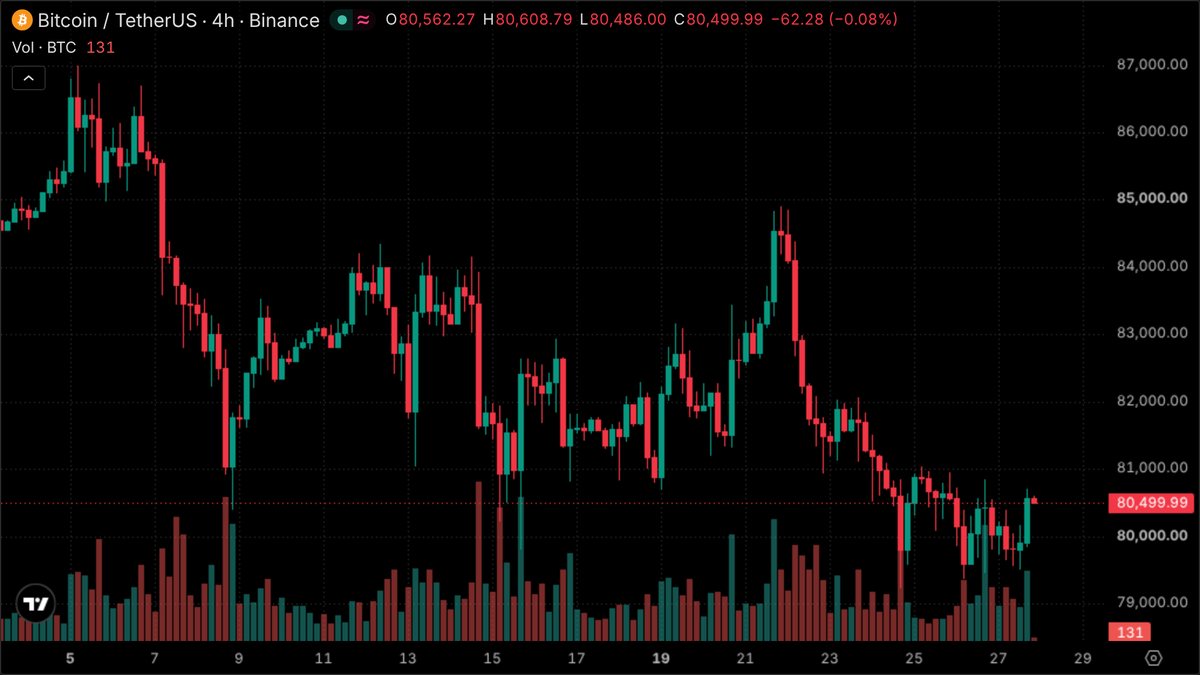
Bitcoin slipped back below $80,000 on the day the Federal Reserve began a two-day policy meeting. Over the past 24 hours the price touched $79,370 before recovering to around $80,000, while Asian equities rallied and crypto stayed behind.
Bitcoin dips under $80,000 as Asian stocks climb
On the morning of Oct. 27 (UTC), Bitcoin traded near $79,700, down 0.4% since midnight and about 2.5% on the week. South Korea's Kospi rose 3.1% in a broad rally in Asian tech shares, but the move did not spread to digital assets. The DeFi index fell 1.8%, the weakest of the major sectors, and Ether lost around 0.5%.
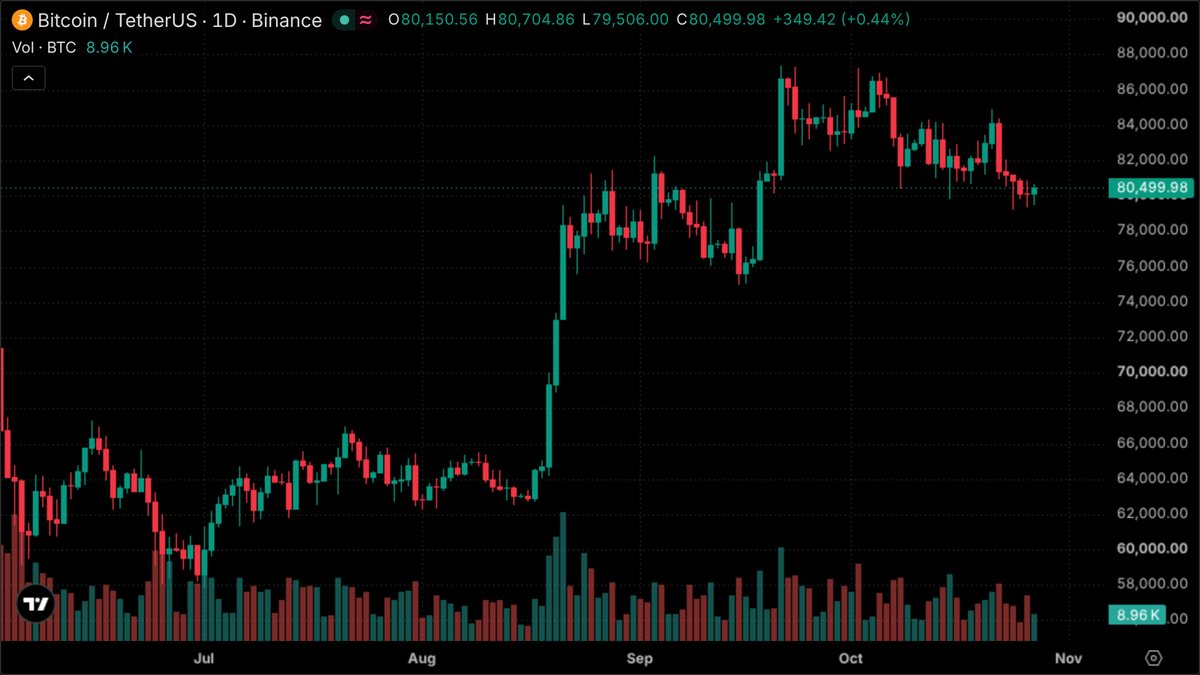
Bitfinex said on Oct. 26 that Bitcoin had closed below $81,300 on Oct. 22, 23 and 24, then dropped to $79,250 on Oct. 24, roughly 9.3% under its September high. For two weeks the price has mostly ranged between $80,000 and $86,000, and the 30-day range has tightened from 13% to 6%. Squeezes like that often end with a sharp move, though the direction is not known in advance.
ETF flows rebound while the Fed remains the open question
US spot Bitcoin ETFs took in $110.3 million on Oct. 26, per Farside Investors data, ending two straight sessions of outflows worth about $773.5 million. All of the net inflow came from BlackRock's IBIT; the other funds reported no net flows. Across the last three sessions the funds are still down roughly $663 million, so one positive day is a signal to watch rather than a trend.
The Fed meeting started on Oct. 27, with the rate decision due Wednesday, Oct. 28, U.S. time. CME's FedWatch tool shows about a 90% chance rates are left unchanged. Markets are focused on the message that comes with the decision, in particular whether another rate increase is still possible before year-end. On the Derive options platform, an at-the-money strategy covering Friday's expiry costs about $2,400, implying a move of around 3% in either direction, which is not unusual for a Fed week.
Bitfinex also estimates that about 874,000 BTC was accumulated between $81,000 and $82,500, meaning many holders have a cost basis above the current price. That is an estimate by price zone rather than confirmed sell orders, but it shows how much potential supply sits above the market if price recovers.
What it means for traders
Derivatives data suggests long positioning has not been abandoned. Across crypto futures, volume rose 18% to $152 billion over 24 hours, open interest (OI, the total value of open contracts) rose only about 0.95%, and liquidations fell 13% to $133 million. Funding rates (the periodic payment between longs and shorts) stayed positive for Bitcoin, Ether and Solana, so longs are still paying to hold. Bitfinex also reports Bitcoin futures OI rising from 645,411 BTC to 669,253 BTC between Oct. 21 and 25 even as price fell. When OI climbs while price drops, a sudden move can trigger chained liquidations.
In options, the $72,000 put expiring Dec. 25 was the most traded contract in the last 24 hours, and 25-delta skews still lean toward downside protection. That points to some participants hedging against a deeper decline rather than waiting for a breakout.
What to watch next: the Fed's message after the meeting, whether ETF inflows hold up in the coming sessions, and how funding behaves if volatility returns. Leveraged traders can use the position size and liquidation price calculator to check their own risk before the rate decision. This article is for information only and is not trading advice.