
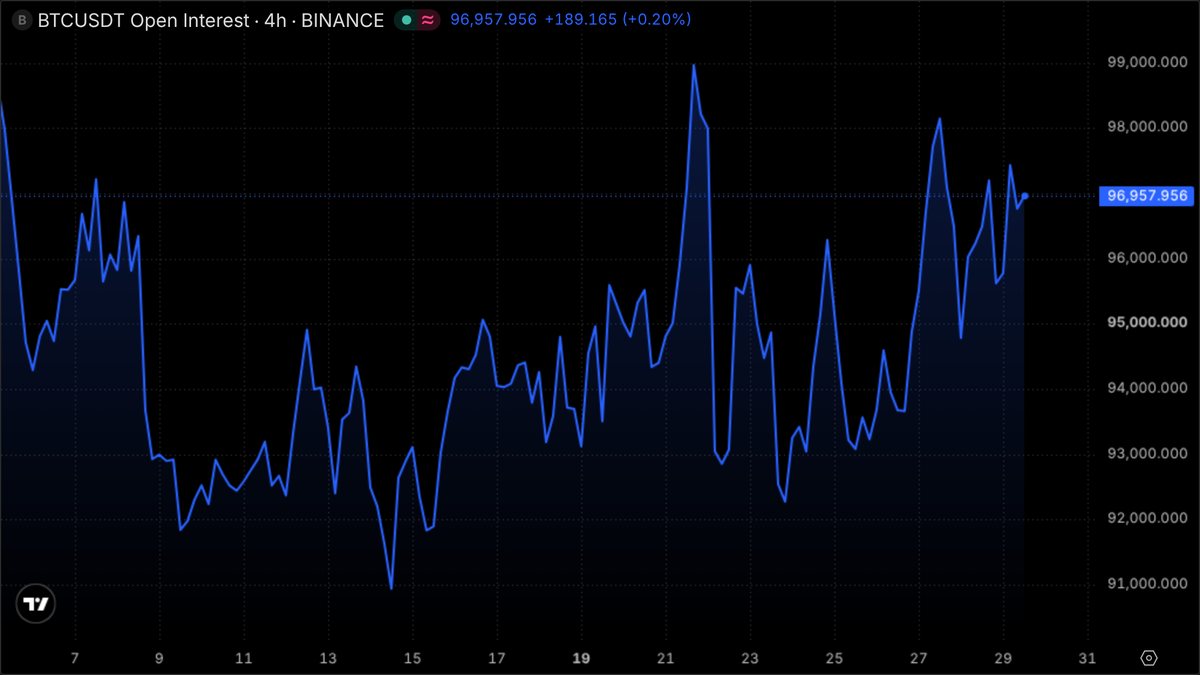
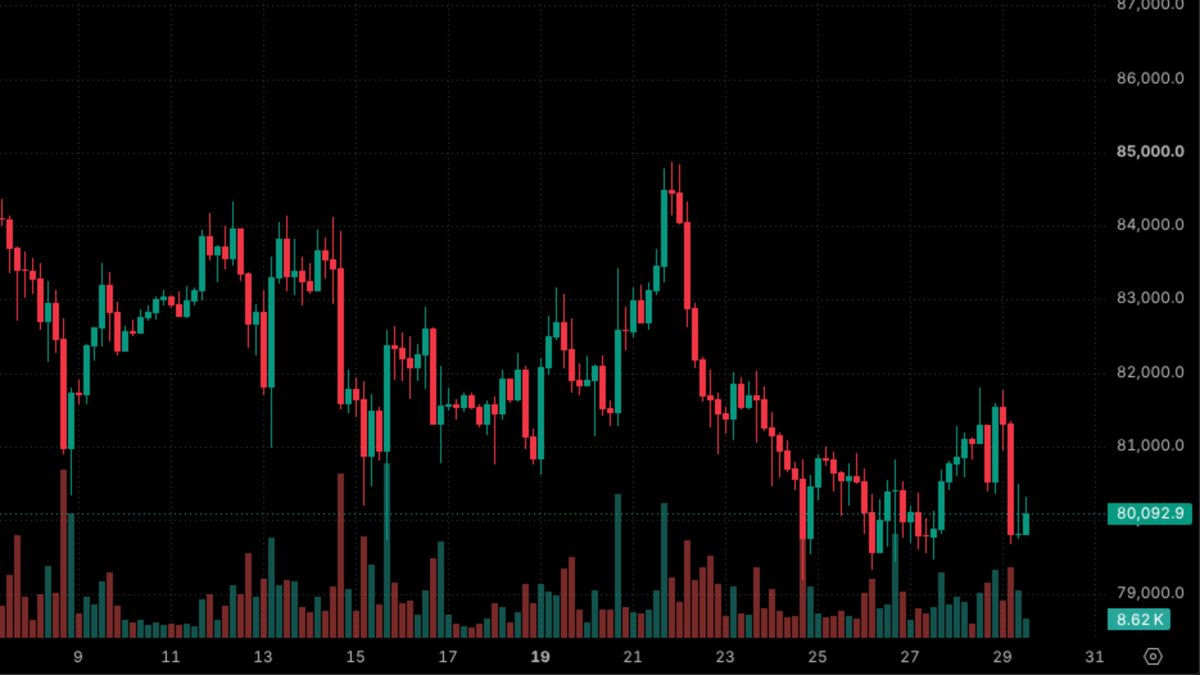
Bitcoin open interest (OI) on Binance has been rising while price falls. Between 30 September and 29 October, OI on the BTCUSDT contract rose about 4.8%, from 92,474 to roughly 96,959 BTC, while the Bitcoin price fell about 4.2%, from 83,577 to around 80,095 USD. This article explains what OI measures, what that pair of figures shows, and what would prove this reading wrong.
What is open interest and what does it measure?
Open interest is the total number of derivatives contracts that are open and not yet closed. Every contract has a buyer (long) and a seller (short) on opposite sides, so OI does not show which side is larger. It only shows how many positions are being held.
OI is not the same as trading volume. Volume counts every order filled over a period, including positions opened and closed straight away. OI only counts what is still open at the moment of measurement. A day of heavy volume with little change in OI means most orders were opened and closed back and forth.
OI can be measured in BTC or converted to USD. When price falls, the same number of contracts is worth less in USD, so the two measures can point to different conclusions. To see whether open positions are growing or shrinking, the BTC measure is the more accurate one.
Four ways to read open interest alongside price
| Price | OI | Common reading |
|---|---|---|
| Up | Up | New positions are being opened with the rise |
| Up | Down | The rise is mostly shorts closing their positions |
| Down | Up | New positions are being opened into the decline |
| Down | Down | Positions are being closed or liquidated and leverage cools |
This is a common reading, not an absolute rule. Bitcoin's last 30 days fall on the third row.
What do the last 30 days of Bitcoin data show?
- Open interest: 92,474 BTC (30 September), about 96,959 BTC now, up roughly 4.8%. The peak for the period was 98,184 BTC (3 October) and the low was 92,378 BTC (12 October).
- Price: 83,577 USD (30 September), about 80,095 USD now, down roughly 4.2%. The 30-day low was 79,179 USD (24 October) and the high was 87,250 USD (2 October).
- OI in USD terms: from 7.73 billion to about 7.77 billion USD, almost flat, ranging between 7.5 and 8.4 billion USD during the month.
OI in USD barely moves because two forces cancel out: the number of contracts rises while the price of each BTC falls. Looking only at the USD figure would miss the fact that open positions have actually grown.
Why does rising OI during a price decline matter?
Rising OI while price falls means more new positions are being opened than closed. There are two common explanations, and OI alone cannot tell them apart:
- Shorts are adding positions to follow the decline.
- Longs are buying more into the decline, lowering their average entry or betting on a bounce.
Leaning towards either one needs other data, such as the funding rate. The funding rate is a periodic payment between longs and shorts; when it is positive, longs pay shorts. Across the last 30 funding intervals on BTCUSDT (about 10 days), 29 were positive, the highest was 0.01% and the latest was about 0.0053%. The 0.01% level is the baseline set by the exchange, so funding does not show either side paying an unusually high price to hold its position.
What can be said with confidence is that leveraged positions have not shrunk with the price. If price reverses sharply, those positions become fuel for liquidations in either direction.
What would prove this reading wrong?
The view that leveraged positions have not shrunk with the price would weaken if any of the following happens:
- OI drops sharply alongside the decline. Over the past 30 days, the largest one-day fall in OI was about 3.2% (from 5 to 6 October). A clearly deeper drop while price is sliding usually signals positions being closed or liquidated in bulk.
- Price rebounds but OI falls. The bounce would then come mainly from shorts closing out, not from fresh buying.
- Price moves sideways for long enough and OI drifts lower. Positions are being closed gradually, without a forced flush.
Levels worth watching
In the 30-day data, price has a low of 79,179 USD (24 October) and a high of 87,250 USD (2 October); OI has a peak of 98,184 BTC (3 October) and a low of 92,378 BTC (12 October). Three scenarios are worth observing around these levels:
- Price breaks below 79,179 USD while OI stays around 95,000 BTC or higher: new positions are still being opened into the decline.
- Price breaks below 79,179 USD while OI drops quickly towards 92,000 to 93,000 BTC: a sign of a positioning flush.
- OI exceeds 98,184 BTC while price sits below 84,711 USD, the 3 October close when OI peaked: the month's heaviest leverage is sitting at lower prices.
Summary
- OI measures contracts that are open; it does not show which side is larger.
- From 30 September to 29 October, Bitcoin OI rose about 4.8% while price fell about 4.2%: open positions have not shrunk with the price.
- Funding is near the baseline, so neither side looks unusually crowded.
- This reading fails if OI drops sharply with the decline, or if a rebound comes with falling OI.
Each exchange displays open interest in its own way; to compare data and tools across exchanges, see the exchange comparison page.