
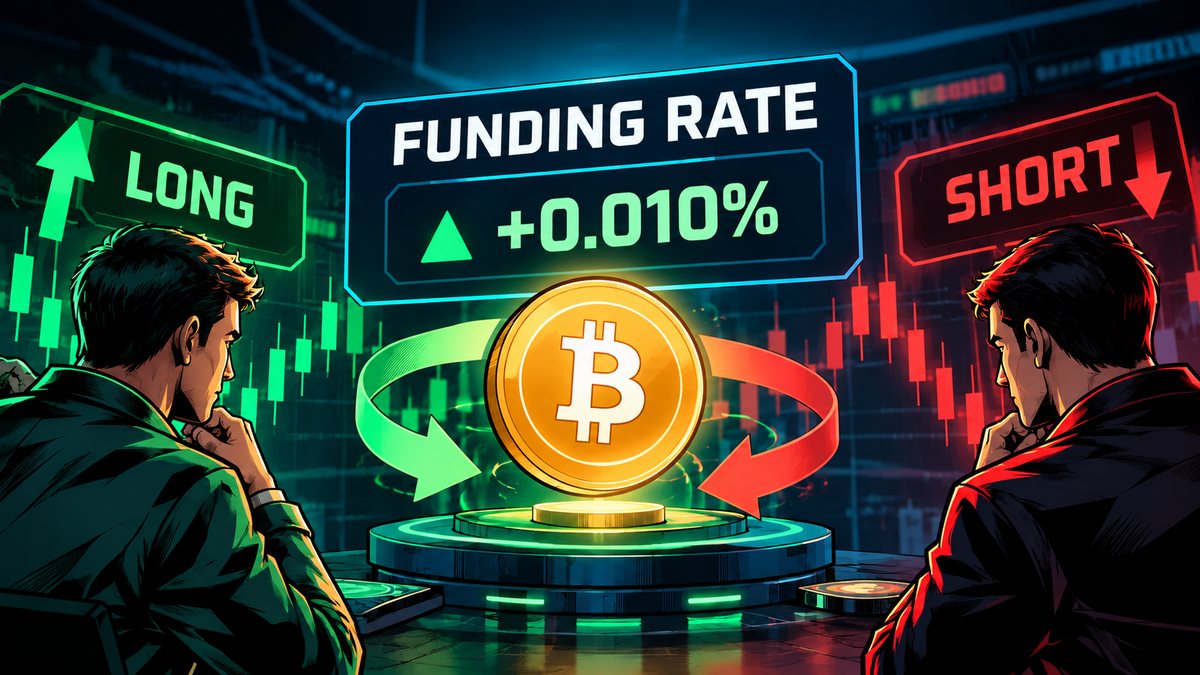
Several days of positive funding are often read as a sign that longs are overcrowded and a reversal is near. This article tests that idea against Bitcoin's own data from the past 10 days, and explains what funding rate and open interest actually measure.
What is the funding rate, and who pays whom?
The funding rate is a periodic payment between long and short traders on perpetual futures, designed to keep the contract price close to spot. When funding is positive, longs pay shorts; when it is negative, shorts pay longs.
The key point: funding only tells you who is paying. It does not tell you how stretched the market is.
What did Bitcoin's last 10 days show?
From October 19 to 28, the BTCUSDT perpetual had 30 funding periods, and 29 of them were positive. The only negative one was the 08:00 period on October 22, at -0.0014%. Five periods hit 0.01%, the baseline level set by the exchange.
Over the same stretch, Bitcoin ran from a low of 79,178 USD to a high of 84,875 USD, a range of roughly 7%. The October 19 daily candle opened at 82,078 USD, and the price at the end of the period was 81,530 USD, almost back where it started.
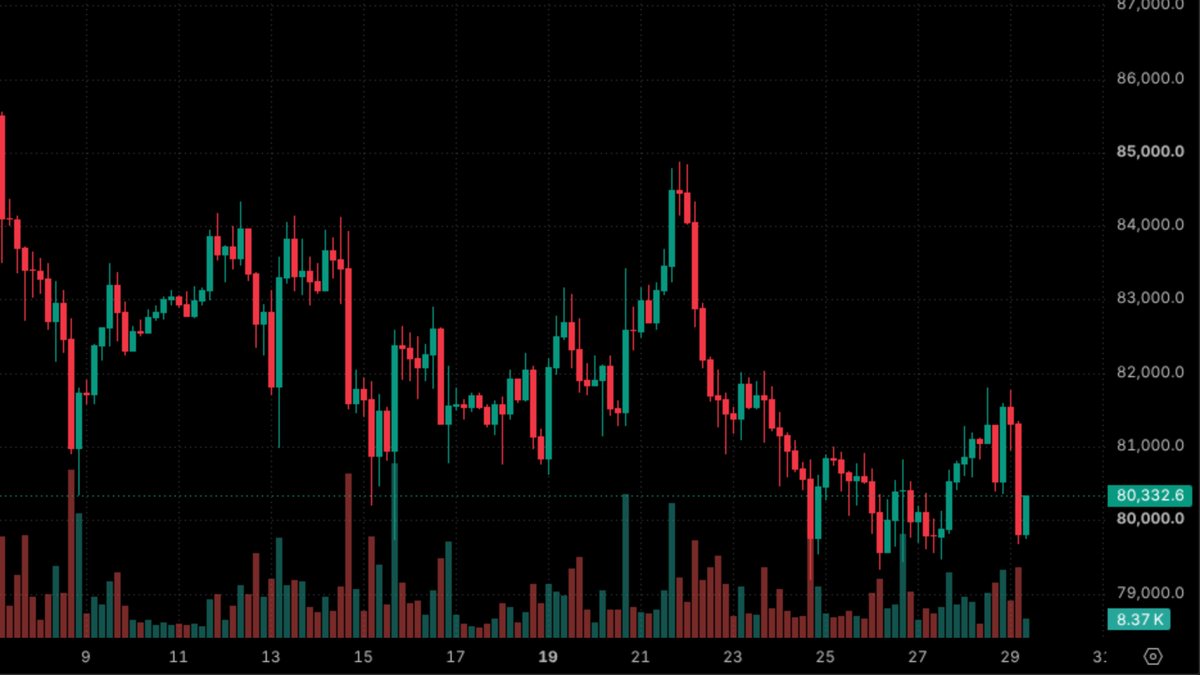
- Funding stayed positive almost throughout.
- Price swung sharply in both directions.
- Net result: price made a full loop with no reversal signalled in advance by funding.
Why funding alone cannot measure how crowded a market is
A rate of 0.01% per 8 hours adds up to under 11% a year. Against the leverage traders typically use, that is a light cost, closer to a parking fee than a heavy burden on longs.
The better gauge of crowding is open interest, the total number of open contracts. The more contracts are open, the larger the wave of closures and liquidations when price turns. A position size and liquidation price calculator can help you see where your own position sits relative to those zones.
How did open interest move in the same period?
- Bitcoin open interest peaked at 98,002 BTC on October 22, the highest in 14 days, worth about 8.24 billion USD.
- By October 24 it had fallen to 93,266 BTC, a drop of 4,736 BTC or about 4.8%.
- Over those three days price fell from the 84,875 USD high to 79,178 USD, while funding barely changed.
Read plainly: positions were built up and then trimmed, and funding gave no advance warning. The thing that moved sharply was the number of open contracts, not the fee.
A caution: the two series moved together within a 14-day window, but it cannot be shown that falling open interest caused the price drop. The same decline can come from liquidations or from traders closing positions voluntarily.
What would prove this view wrong?
If funding rises clearly above the 0.01% baseline for several periods in a row while open interest climbs past 98,000 BTC and price fails to advance, funding would be carrying information the past 10 days did not, and the thesis would need revisiting.
What to watch next
- Funding turning negative for a sustained stretch while price moves sideways. Shorts become the payers and the story flips.
- Open interest returning to the 98,000 BTC area, and how price reacts there.
Summary
Do not read funding on its own. Put it next to open interest and the candles, and ask two questions: is the number of open contracts rising or falling, and is price moving in the same direction as the side paying the fee? Over these 10 days, anyone shorting on positive funding alone would have had to sit through a 7% swing with no signal from funding. See also our exchange comparison if you are choosing where to trade futures.